Unrealscript Debugging: Difference between revisions
From Unreal Tournament 2004 MiA Wiki
Created page with " *UTrace - simple on/off. When on it floods the log, so be careful. When on can easy flood log with GB of output! *UTrack - enter to console for see help. Works only when UTrace is enabled. Can pass class name or object nameas the frst argument. The second is property name. *:Changes will appear in UTrace log as on screens above. *UProfile - collect all uscript usage and on turn off dump in format which almost json and can be parsed by js if need. Or some tools. *:It..." |
No edit summary |
||
| Line 1: | Line 1: | ||
===New (to UT2004) debugging console commands=== | |||
*Console command <code>Utrace</code> - simple on/off togglr. When on it floods the log, so be careful. When on can easy flood log with GB of output! | |||
* | *:[[File:Utrace.png]] | ||
*UTrack - enter to console for see help. | *Console command <code>UTrack ObjectName PropertyName</code> - enter to console for see help. It works only when UTrace is enabled. You can pass class name or object name as the first argument, and property name as the second value. | ||
*:[[File:Utrack.png]] | |||
*:Changes will appear in UTrace log as on screens above. | *:Changes will appear in UTrace log as on screens above. | ||
*UProfile - collect all uscript usage and on turn off dump in format which almost json and can be parsed by js if need. Or some tools. | *Console command <code>UProfile</code> - collect all uscript usage and on turn off dump in format which almost json and can be parsed by js if need. Or some tools. | ||
*:It is good for finding slow functions or | *:[[File:Uprofile.png]] | ||
*DEBUGBREAK - when called in code emits a break for the debugger. | *:It is good for finding slow functions or functions that are called a lot, to allow you to optimise code. | ||
*Console command <code>DEBUGBREAK</code> - when called in code emits a break for the C++ debugger (not UDebugger). It's for engine developers where they have code & pdb files, and need stop in an exact place. They can modify code and emit that console command and the engine will stopin the desired place. | |||
UProfile ends automatically when game exits. | <code>UProfile</code> ends automatically when game exits. | ||
Utrace and Uprofile commands can be passed as arguments for game and that turns them on in an early stage to get info about engine startup. | <code>Utrace</code> and <code>Uprofile</code> commands can be passed as arguments for game and that turns them on in an early stage to get info about engine startup. | ||
Revision as of 23:03, 25 February 2026
New (to UT2004) debugging console commands
- Console command
Utrace- simple on/off togglr. When on it floods the log, so be careful. When on can easy flood log with GB of output! - Console command
UTrack ObjectName PropertyName- enter to console for see help. It works only when UTrace is enabled. You can pass class name or object name as the first argument, and property name as the second value.
- Changes will appear in UTrace log as on screens above.
- Console command
UProfile- collect all uscript usage and on turn off dump in format which almost json and can be parsed by js if need. Or some tools.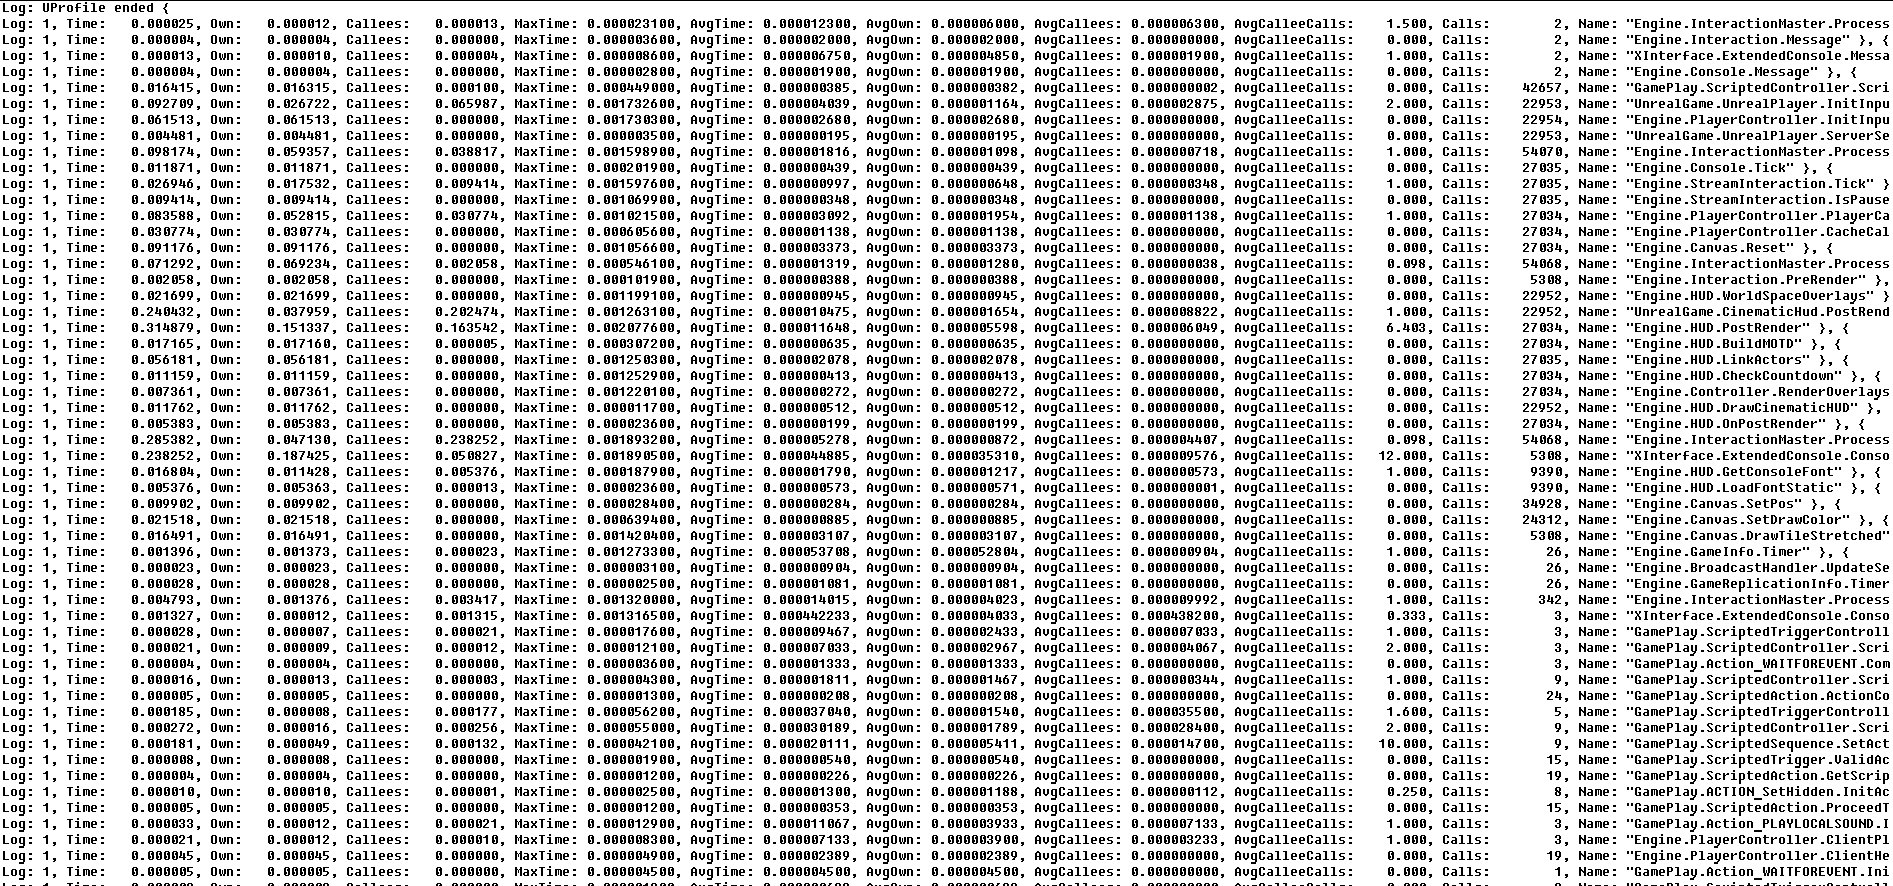
- It is good for finding slow functions or functions that are called a lot, to allow you to optimise code.
- Console command
DEBUGBREAK- when called in code emits a break for the C++ debugger (not UDebugger). It's for engine developers where they have code & pdb files, and need stop in an exact place. They can modify code and emit that console command and the engine will stopin the desired place.


UProfile ends automatically when game exits.
Utrace and Uprofile commands can be passed as arguments for game and that turns them on in an early stage to get info about engine startup.
